Tabula
Data Aggregation and Visualization: Enhancing Insights through Effective Techniques In today's data-driven world, data aggregation and visualization play a crucial role in transforming raw data into meaningful insights. By collecting and organizing data from various sources, businesses can gain a comprehensive view of their operations and make informed decisions. Data aggregation involves compiling data from multiple sources, which can include databases, spreadsheets, and online platforms. This process not only streamlines data management but also ensures that the information is accurate and up-to-date. Once the data is aggregated, visualization techniques come into play. Visualization is the graphical representation of data, making complex information easier to understand. Effective visualization techniques, such as charts, graphs, and dashboards, allow users to quickly identify trends, patterns, and anomalies. By presenting data visually, organizations can enhance their analytical capabilities and communicate findings more effectively. To maximize the benefits of data aggregation and visualization, it is essential to choose the right tools and technologies. Many software solutions are available that offer robust features for data integration and visualization, enabling users to create interactive and dynamic reports. In conclusion, data aggregation and visualization are vital for organizations looking to leverage their data for strategic advantage. By implementing effective techniques and tools, businesses can improve their decision-making processes and drive better outcomes.
AI Project Details
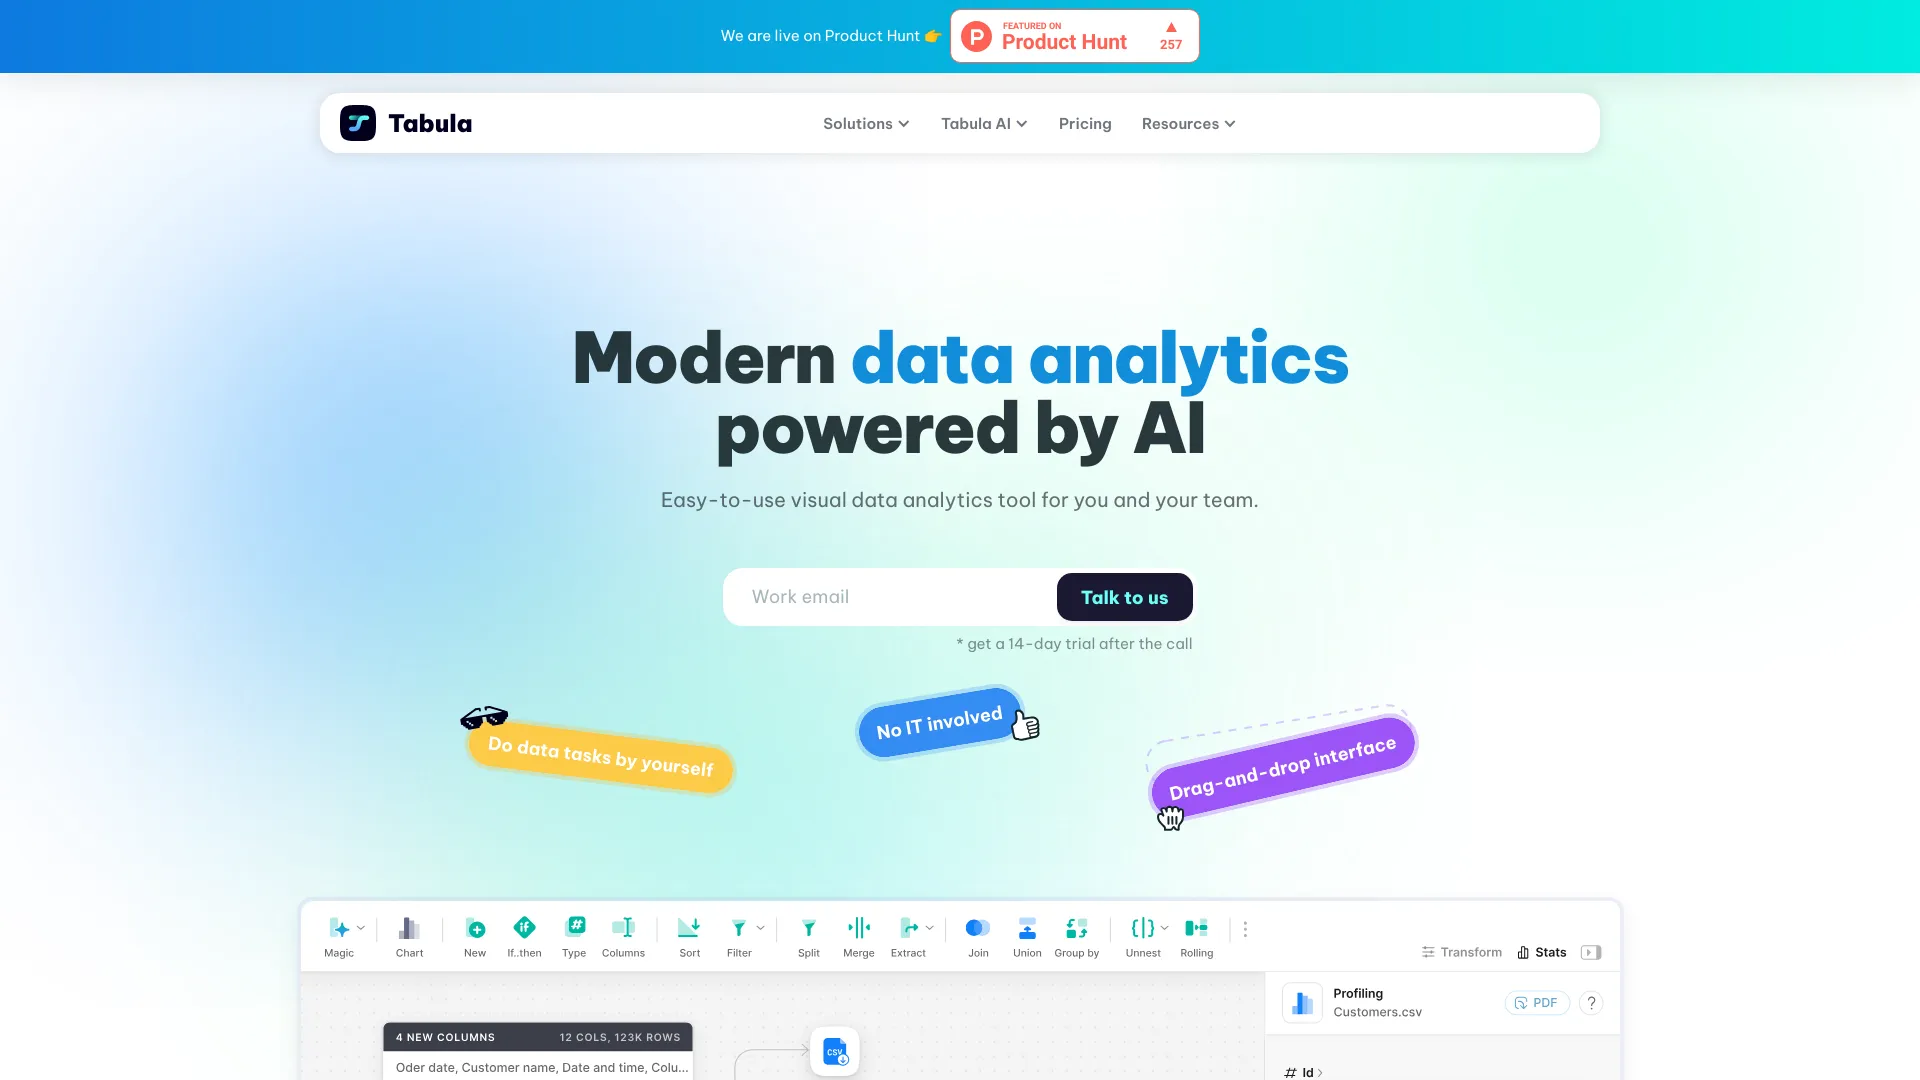
What is Tabula?
Tabula is an AI-powered platform for business and data teams to aggregate, transform, and visualize data. It is the only tool you need to start making data-driven decisions.
How to use Tabula?
Start working with data without any training. Our visual tools enable you to perform even complex transforms such as Pivot, Aggregate, or VLookup effortlessly. Access and activate all your customer data with our no-code segment builder. Add stunning charts for ad-hoc analysis and build interactive reports to share your insights with your colleagues.
Tabula's Core Features
- Automated report generation
- Centralized and automated data aggregation
- AI-powered data insights
Tabula's Use Cases
- Ad-hoc analytics
- Customer segmentation
- Financial data reporting
FAQ from Tabula
Is Tabula easy to use?
Yes, Tabula is designed to be user-friendly, allowing anyone to utilize its features without extensive training.
Tabula Support
Here is the Tabula support email for customer service: [email protected].
For more contact options, visit the contact us page.
Tabula Company
Tabula Company name: Retable, Inc.
Tabula Pricing
For pricing information, visit the Tabula Pricing Link.
Tabula on LinkedIn
Follow us on LinkedIn: Tabula LinkedIn Link.