vizGPT
VizGPT: Transforming Text into Interactive Visual Charts In today's data-driven world, visual representation of information is crucial. VizGPT is a cutting-edge platform that seamlessly converts text into interactive visual charts, making data more accessible and engaging for users. Why Choose VizGPT? 1. **User-Friendly Interface**: VizGPT offers an intuitive design that allows users to easily input text and generate charts without any technical expertise. 2. **Interactive Features**: The platform provides interactive elements that enable users to explore data in depth, enhancing understanding and retention. 3. **Versatile Chart Options**: Whether you need bar graphs, line charts, or pie charts, VizGPT supports a variety of visual formats to suit your data presentation needs. 4. **Real-Time Updates**: Users can update their text inputs and see changes reflected in the charts instantly, ensuring that the information is always current. 5. **Enhanced Data Insights**: By visualizing text data, VizGPT helps users uncover trends and insights that may not be immediately apparent in raw text. Get Started with VizGPT Today! Unlock the power of your data with VizGPT. Transform your text into stunning visual charts that captivate your audience and enhance your presentations. Experience the future of data visualization now!
AI Project Details
What is vizGPT?
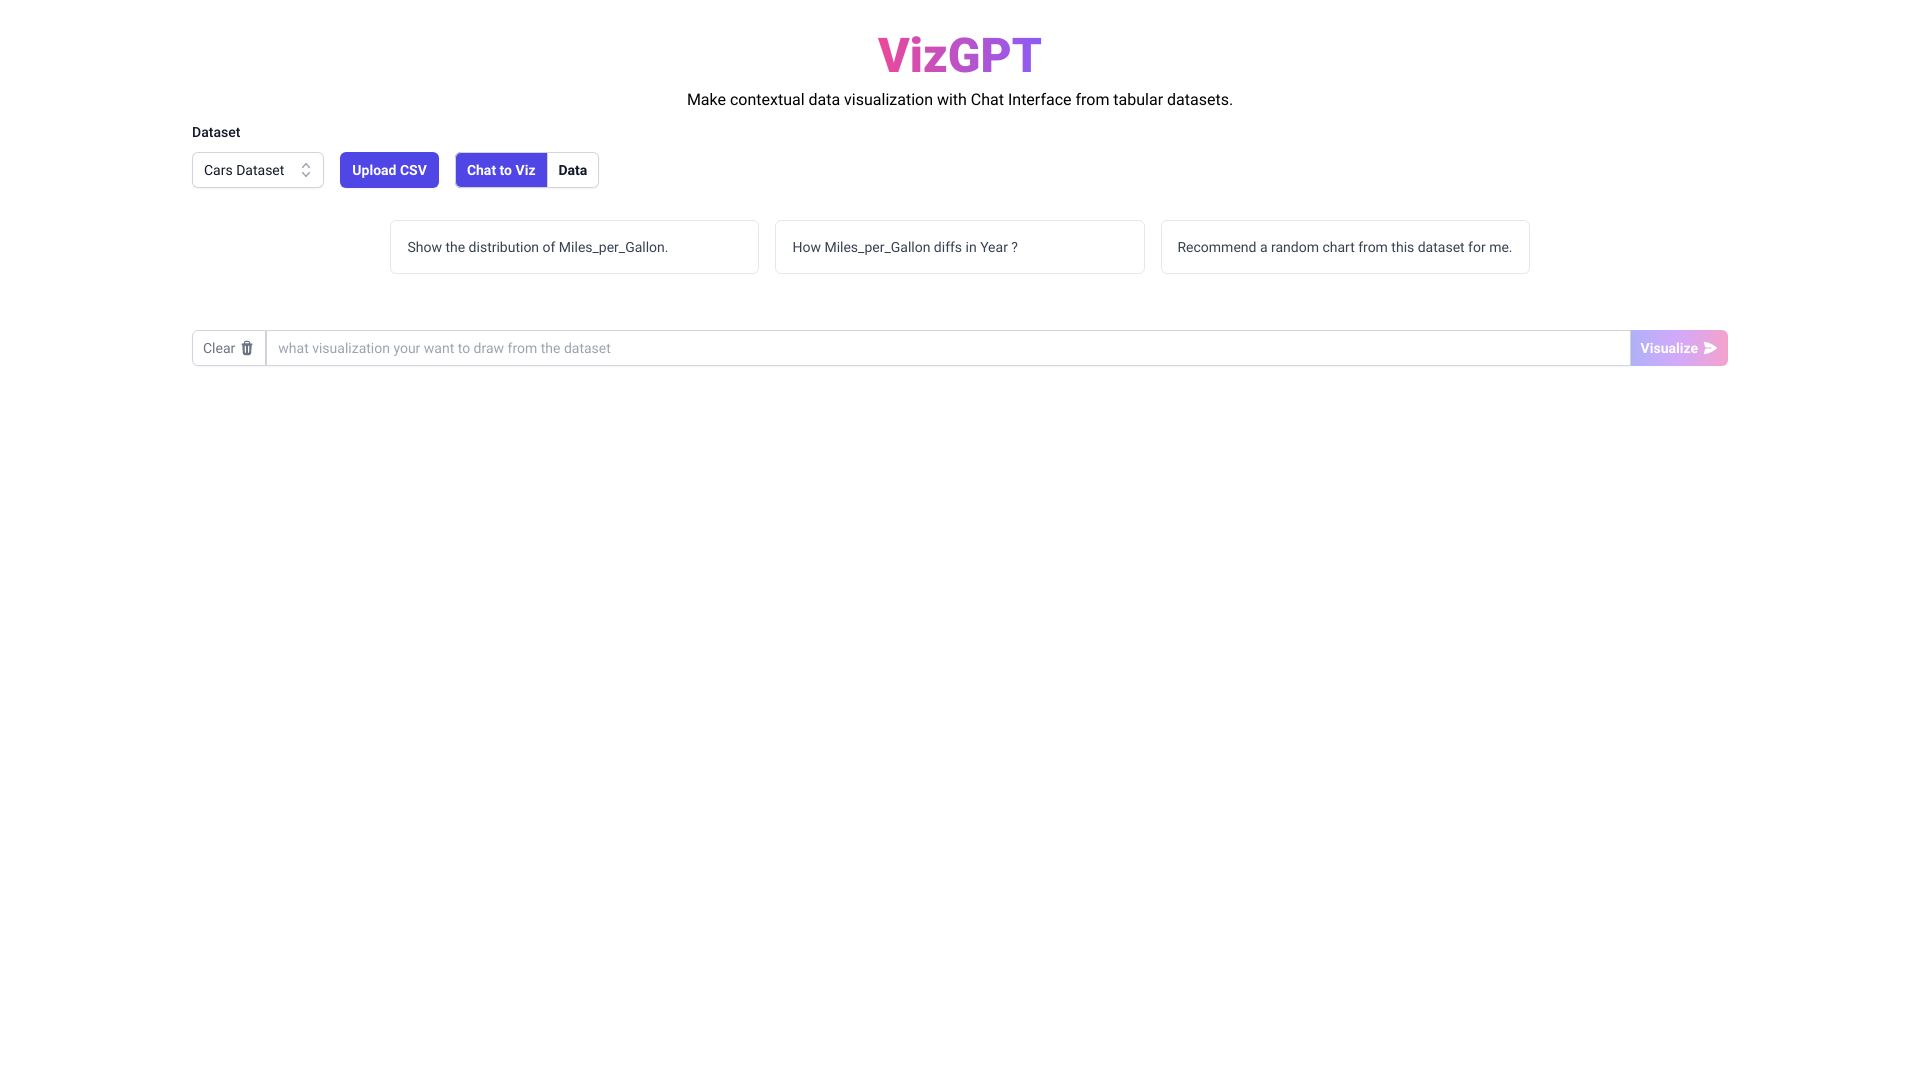
VizGPT is a data visualization platform with a chat interface, designed to transform contextual data into interactive visual charts. It leverages advanced models such as chartGPT, vizGPT, text2viz, and text2chart to generate meaningful visual representations from textual input.
How to use vizGPT?
To use VizGPT, simply input your contextual data into the chat interface and engage in a conversation. VizGPT will interpret your text and generate interactive visualizations based on the provided information. You can further refine and customize the visualizations by specifying chart types, desired dimensions, colors, and labels.
vizGPT's Core Features
- Contextual data visualization through natural language processing
- Interactive visual charts based on advanced models
- Customization options for chart types, dimensions, colors, and labels
- Seamless chat interface for intuitive communication
- Real-time updates and adjustments to visualizations as the conversation progresses
vizGPT's Use Cases
VizGPT can be used in various scenarios, including:
- Analyzing and visualizing data from business reports
- Creating visual representations of survey responses
- Exploring trends and patterns in social media discussions
- Converting textual research findings into graphical presentations
- Assisting in decision-making processes by providing visual insights
FAQ from vizGPT
What types of visualizations can VizGPT generate?
VizGPT can generate a variety of visualizations including bar charts, line graphs, pie charts, and more.
Can I customize the appearance of the visual charts?
Yes, you can customize the appearance by selecting different chart types, colors, and labels.