CalcGen AI
Create Interactive Charts and Graphs Using AI Effortlessly In today's data-driven world, visualizing information is crucial for effective communication. With the power of AI, creating interactive charts and graphs has never been easier. Whether you're a business professional, educator, or data analyst, you can now transform complex data into engaging visuals that captivate your audience. Why Choose AI for Chart Creation? AI technology streamlines the process of generating charts and graphs, allowing you to focus on insights rather than manual formatting. By leveraging advanced algorithms, you can create stunning visuals in just a few clicks. This not only saves time but also enhances the accuracy of your data representation. Key Features of AI-Powered Chart Creation Enhance Your Data Presentation By utilizing AI to create interactive charts and graphs, you can significantly improve your data presentation. These visuals not only make your information more digestible but also encourage audience interaction, leading to better retention and understanding. Start Creating Today Don't let your data go unnoticed. Embrace the power of AI to create interactive charts and graphs effortlessly. Transform your presentations and reports into compelling narratives that resonate with your audience. Experience the future of data visualization now!
Category:image ai-charting
Create At:2024-12-23
CalcGen AI AI Project Details
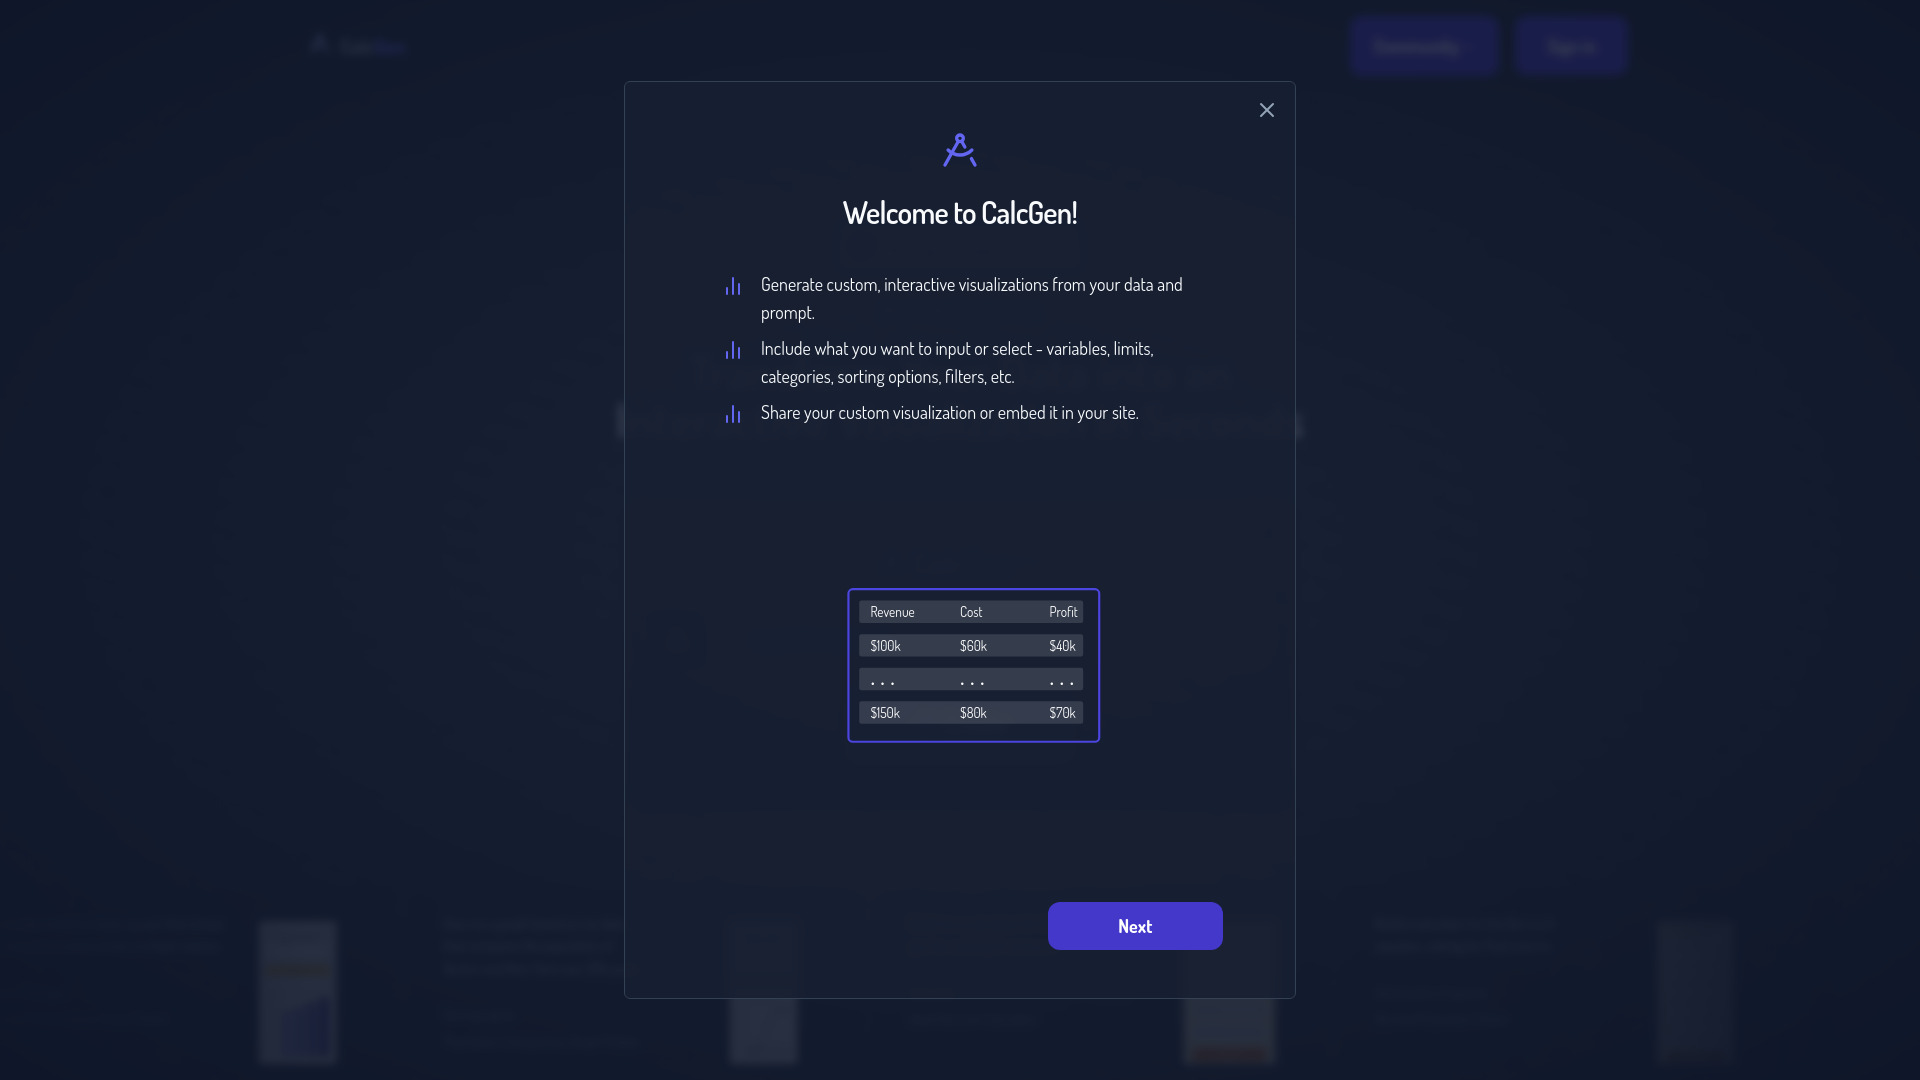
What is CalcGen AI?
CalcGen AI is an interactive tool that allows users to create customizable charts, graphs, and calculators effortlessly using AI.
How to use CalcGen AI?
Simply describe the data you want visualized or the calculator you need, and CalcGen AI will generate it for you.
CalcGen AI's Core Features
- Interactive charts and graphs
- Customizable calculators
- Data visualization from various inputs
- Embedding options for websites
CalcGen AI's Use Cases
- Generate graphs comparing financial performance across multiple metrics
- Create calculators for scientific formulas like ideal gas law and compound interest
FAQ from CalcGen AI
What types of visualizations can CalcGen AI create?
CalcGen AI can create a variety of visualizations including bar charts, line graphs, and pie charts based on user input.
Do I need to upload my data to use CalcGen AI?
No, you do not need to upload your data. You can simply describe the data you want to visualize.
CalcGen AI Company
CalcGen AI Company name: CalcGen AI.