Chartify
Chartify: Transform Your Data into Interactive Charts with AI Are you looking for a way to visualize your data effectively? Look no further than Chartify, an innovative AI tool designed to turn your data into stunning interactive charts. With Chartify, you can easily create visual representations of your data that not only look great but also enhance understanding and engagement. Key Features of Chartify: Why Choose Chartify?
Chartify stands out in the crowded market of data visualization tools by combining advanced AI technology with user-centric design. Whether you're a business professional, educator, or data analyst, Chartify provides the tools you need to make your data come alive. Start using Chartify today and elevate your data visualization game!
Category:image ai-charting
Create At:2024-12-23
Chartify AI Project Details
What is Chartify?
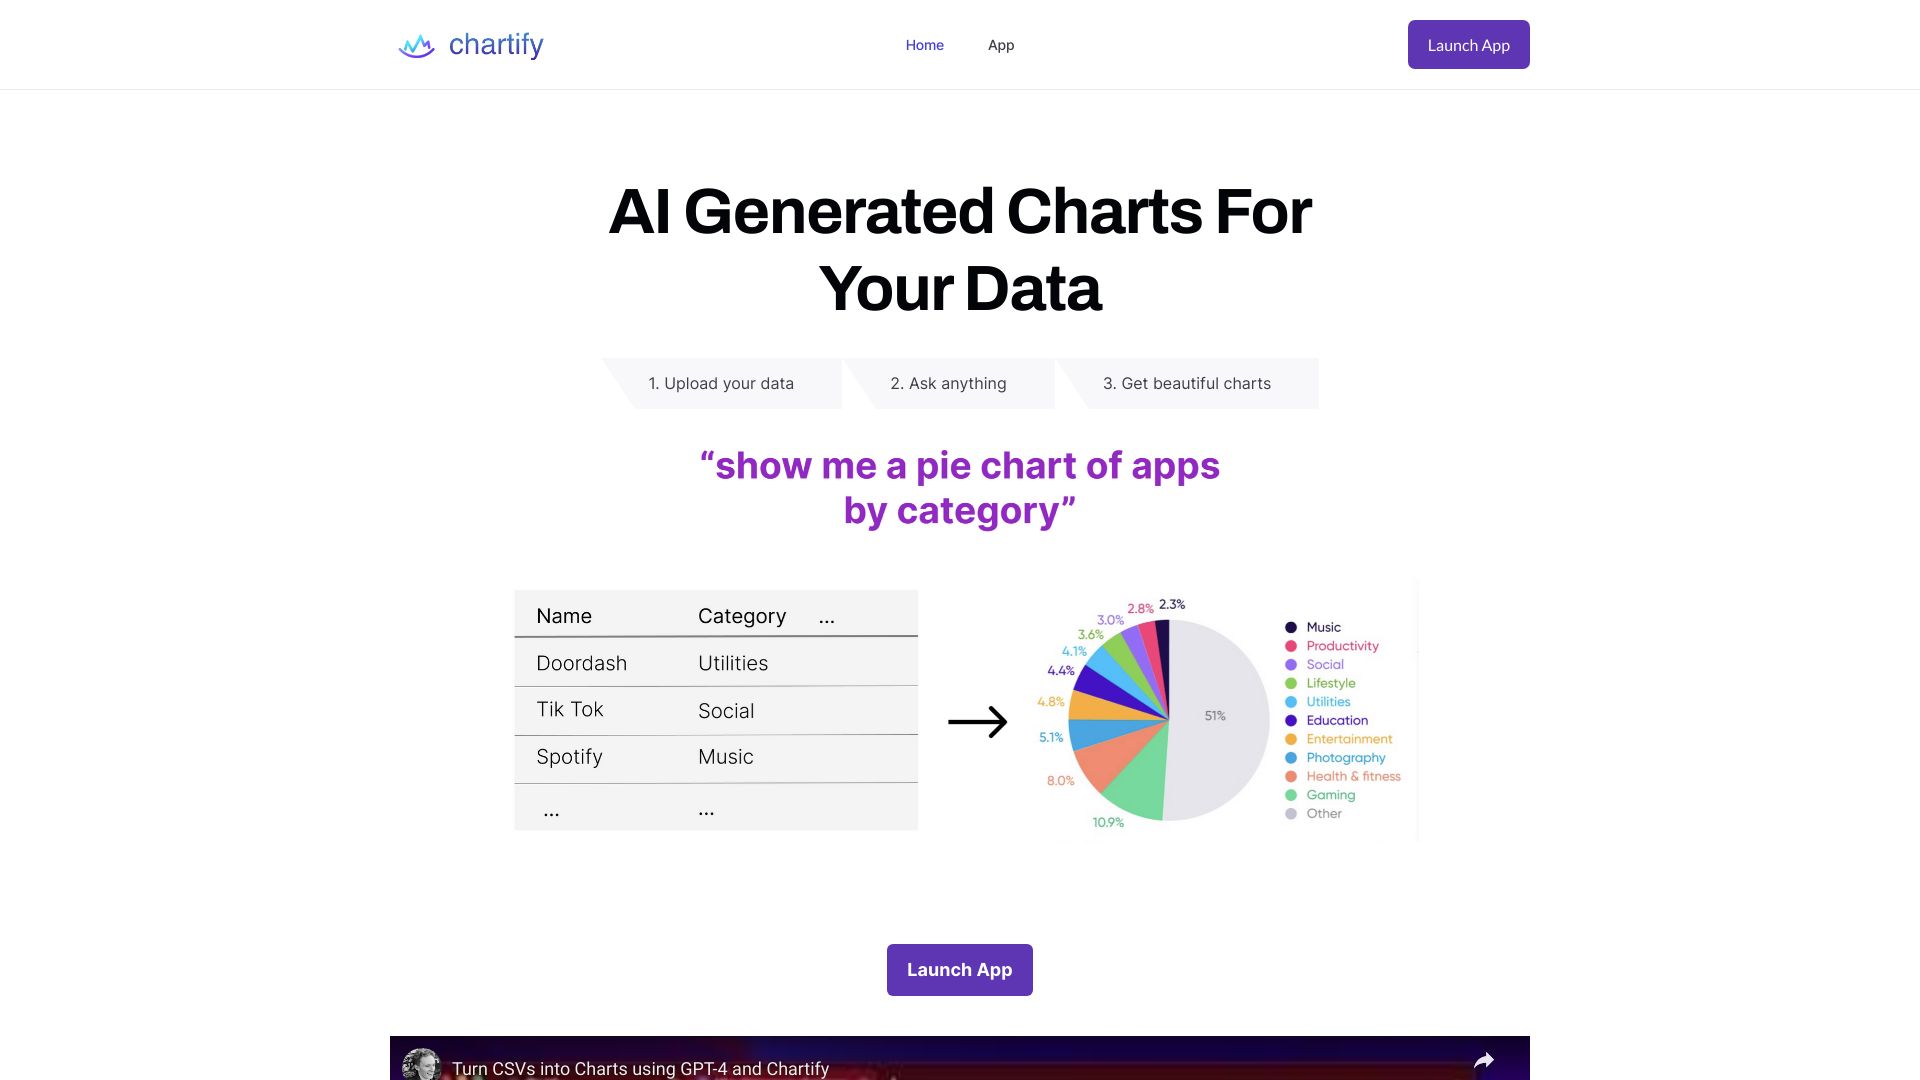
Chartify is an AI-generated charting tool that allows users to turn CSVs and database tables into rich, interactive charts and graphs. It offers a new way to visualize data, providing AI-recommended visualizations and allowing users to ask for specific chart types.
How to use Chartify?
To use Chartify, follow these steps:
- Upload your data by either uploading a CSV file or connecting to a Postgres or MySQL database.
- Get recommended visualizations, which will be generated by the AI based on your data.
- Ask for specific charts by specifying your desired chart type, such as a stacked bar chart of revenue growth by product line over the last 20 years.
Chartify's Core Features
- AI-generated visualizations
- Support for CSV files and database connections
- Wide range of charting options, including pie charts, line graphs, bar charts, and more
- Integration with Plotly, Matplotlib, Seaborn, and Charts.js
Chartify's Use Cases
- Data analysis
- Data visualization
- Reporting
- Presentations
- Business intelligence
FAQ from Chartify
What types of data sources does Chartify support?
Can I ask for specific chart types?
Which charting libraries does Chartify integrate with?
What kind of users can benefit from using Chartify?